Reports / publications
The archive of what was delivered.
Deliverables, publications and APK packages presented as a clean, launch-ready archive.

BLUE-X accelerates offshore renewable energy projects by combining Copernicus Earth observation, MetOcean data and decision-support tools across planning, construction, operation and decommissioning. It helps reduce costs and deployment time while supporting Europe’s transition to clean, secure and sustainable energy.
Oil Spill AR transforms georeferenced spill data into an interactive tabletop simulation. Users can select an incident from a floating 3D globe, place its evolution over a real-world map and explore how environmental conditions influence the movement and concentration of the oil.
Rotate the globe. Observe the spill. Test a containment barrier.
Drag the three-dimensional globe to inspect the planet and find the highlighted spill. Its position is tied to the geographic geometry supplied by latitude and longitude data.
The concentration field evolves over a real map through a mass-conserving surface transport simulation. Use the controls to inspect a longer sequence while the map remains in a clear, high-resolution top view.
Add points directly on the map and apply the barrier. The line becomes an impermeable boundary: the oil cannot cross it, accumulates against it and spreads along the remaining available space.
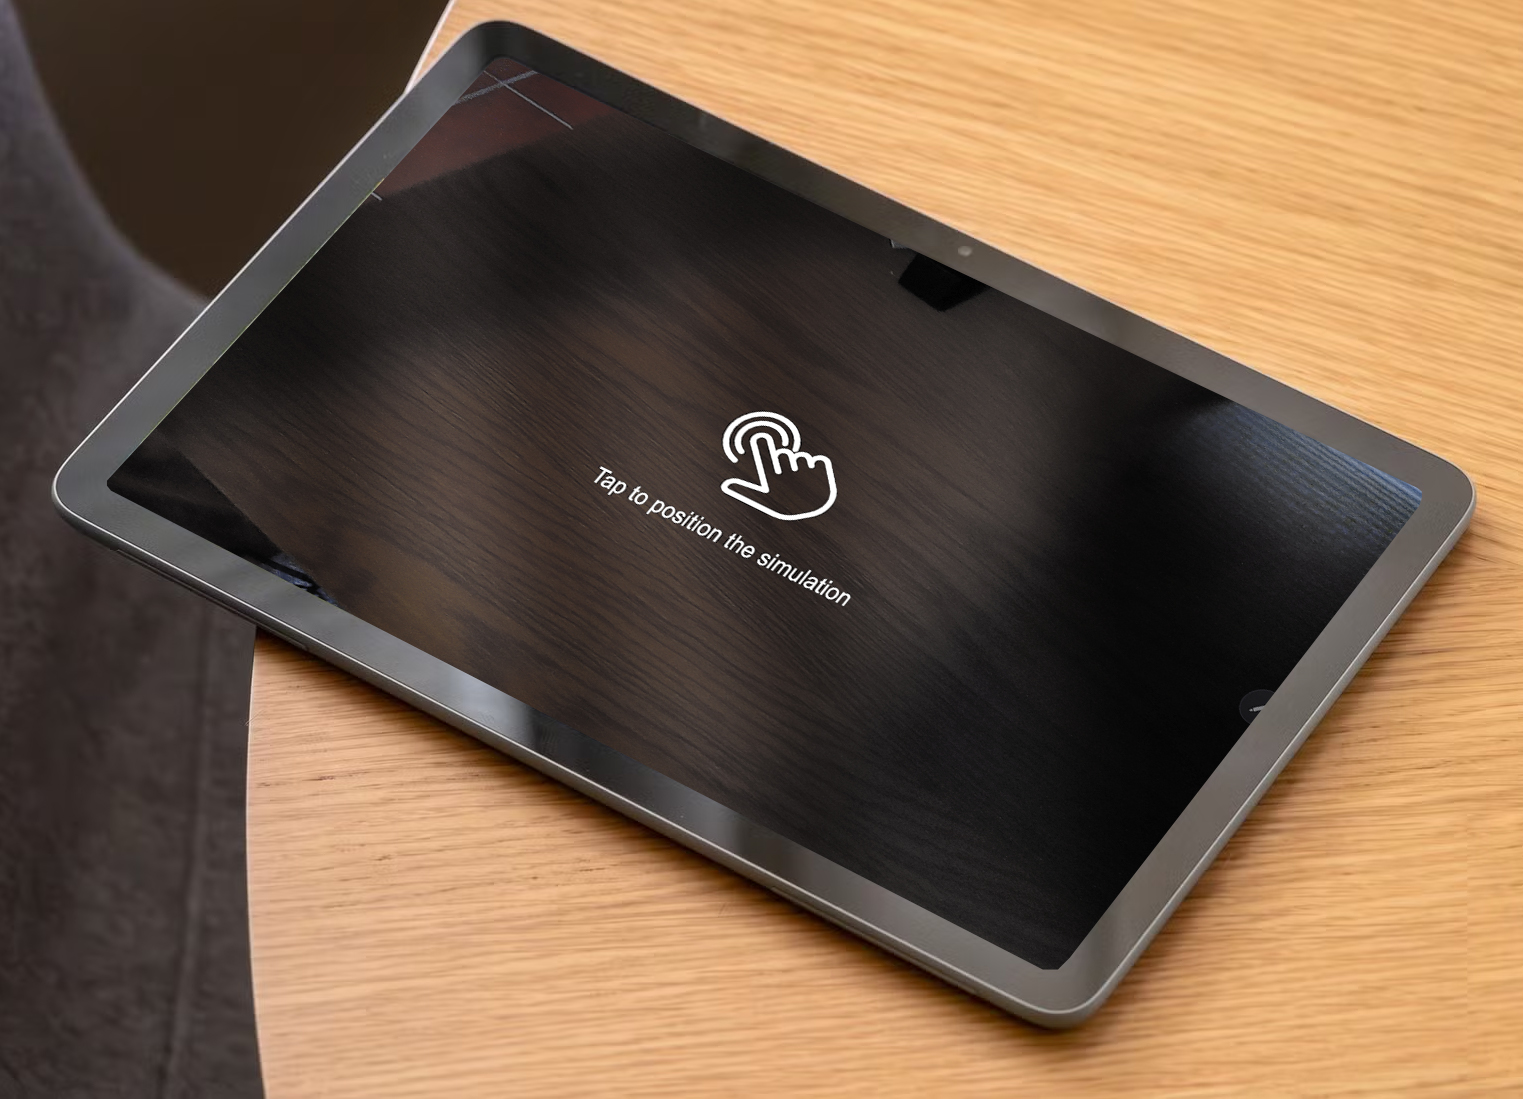
The experience begins by locating and opening the selected spill scenario.
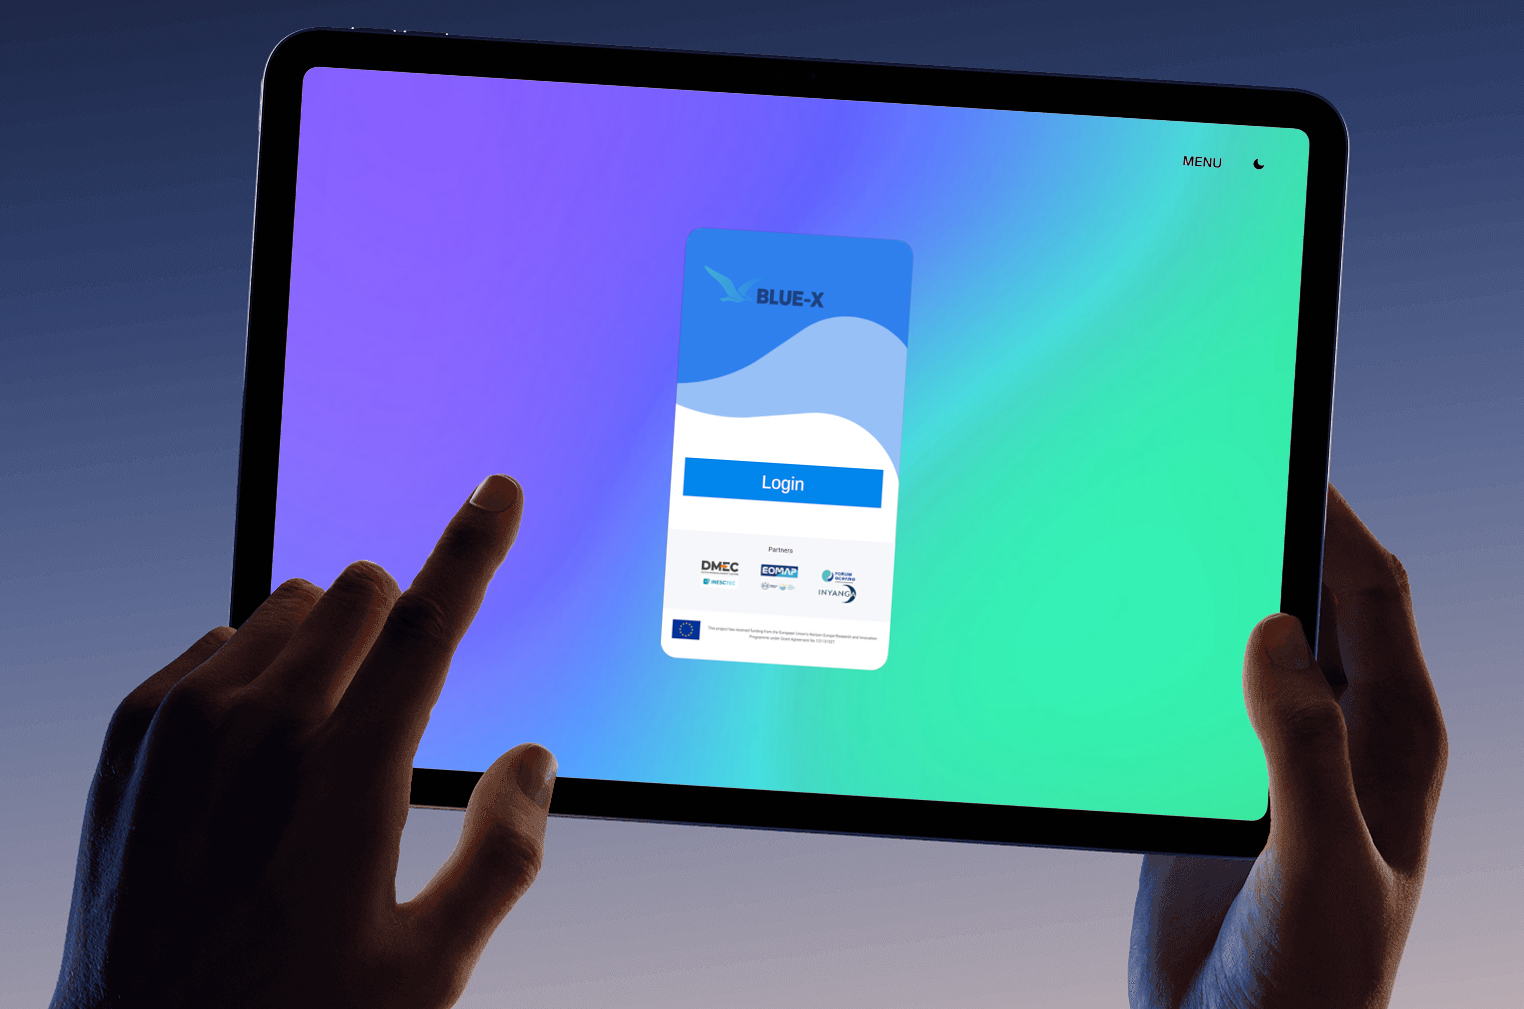
Geographic coordinates connect each event to its position on the 3D globe.
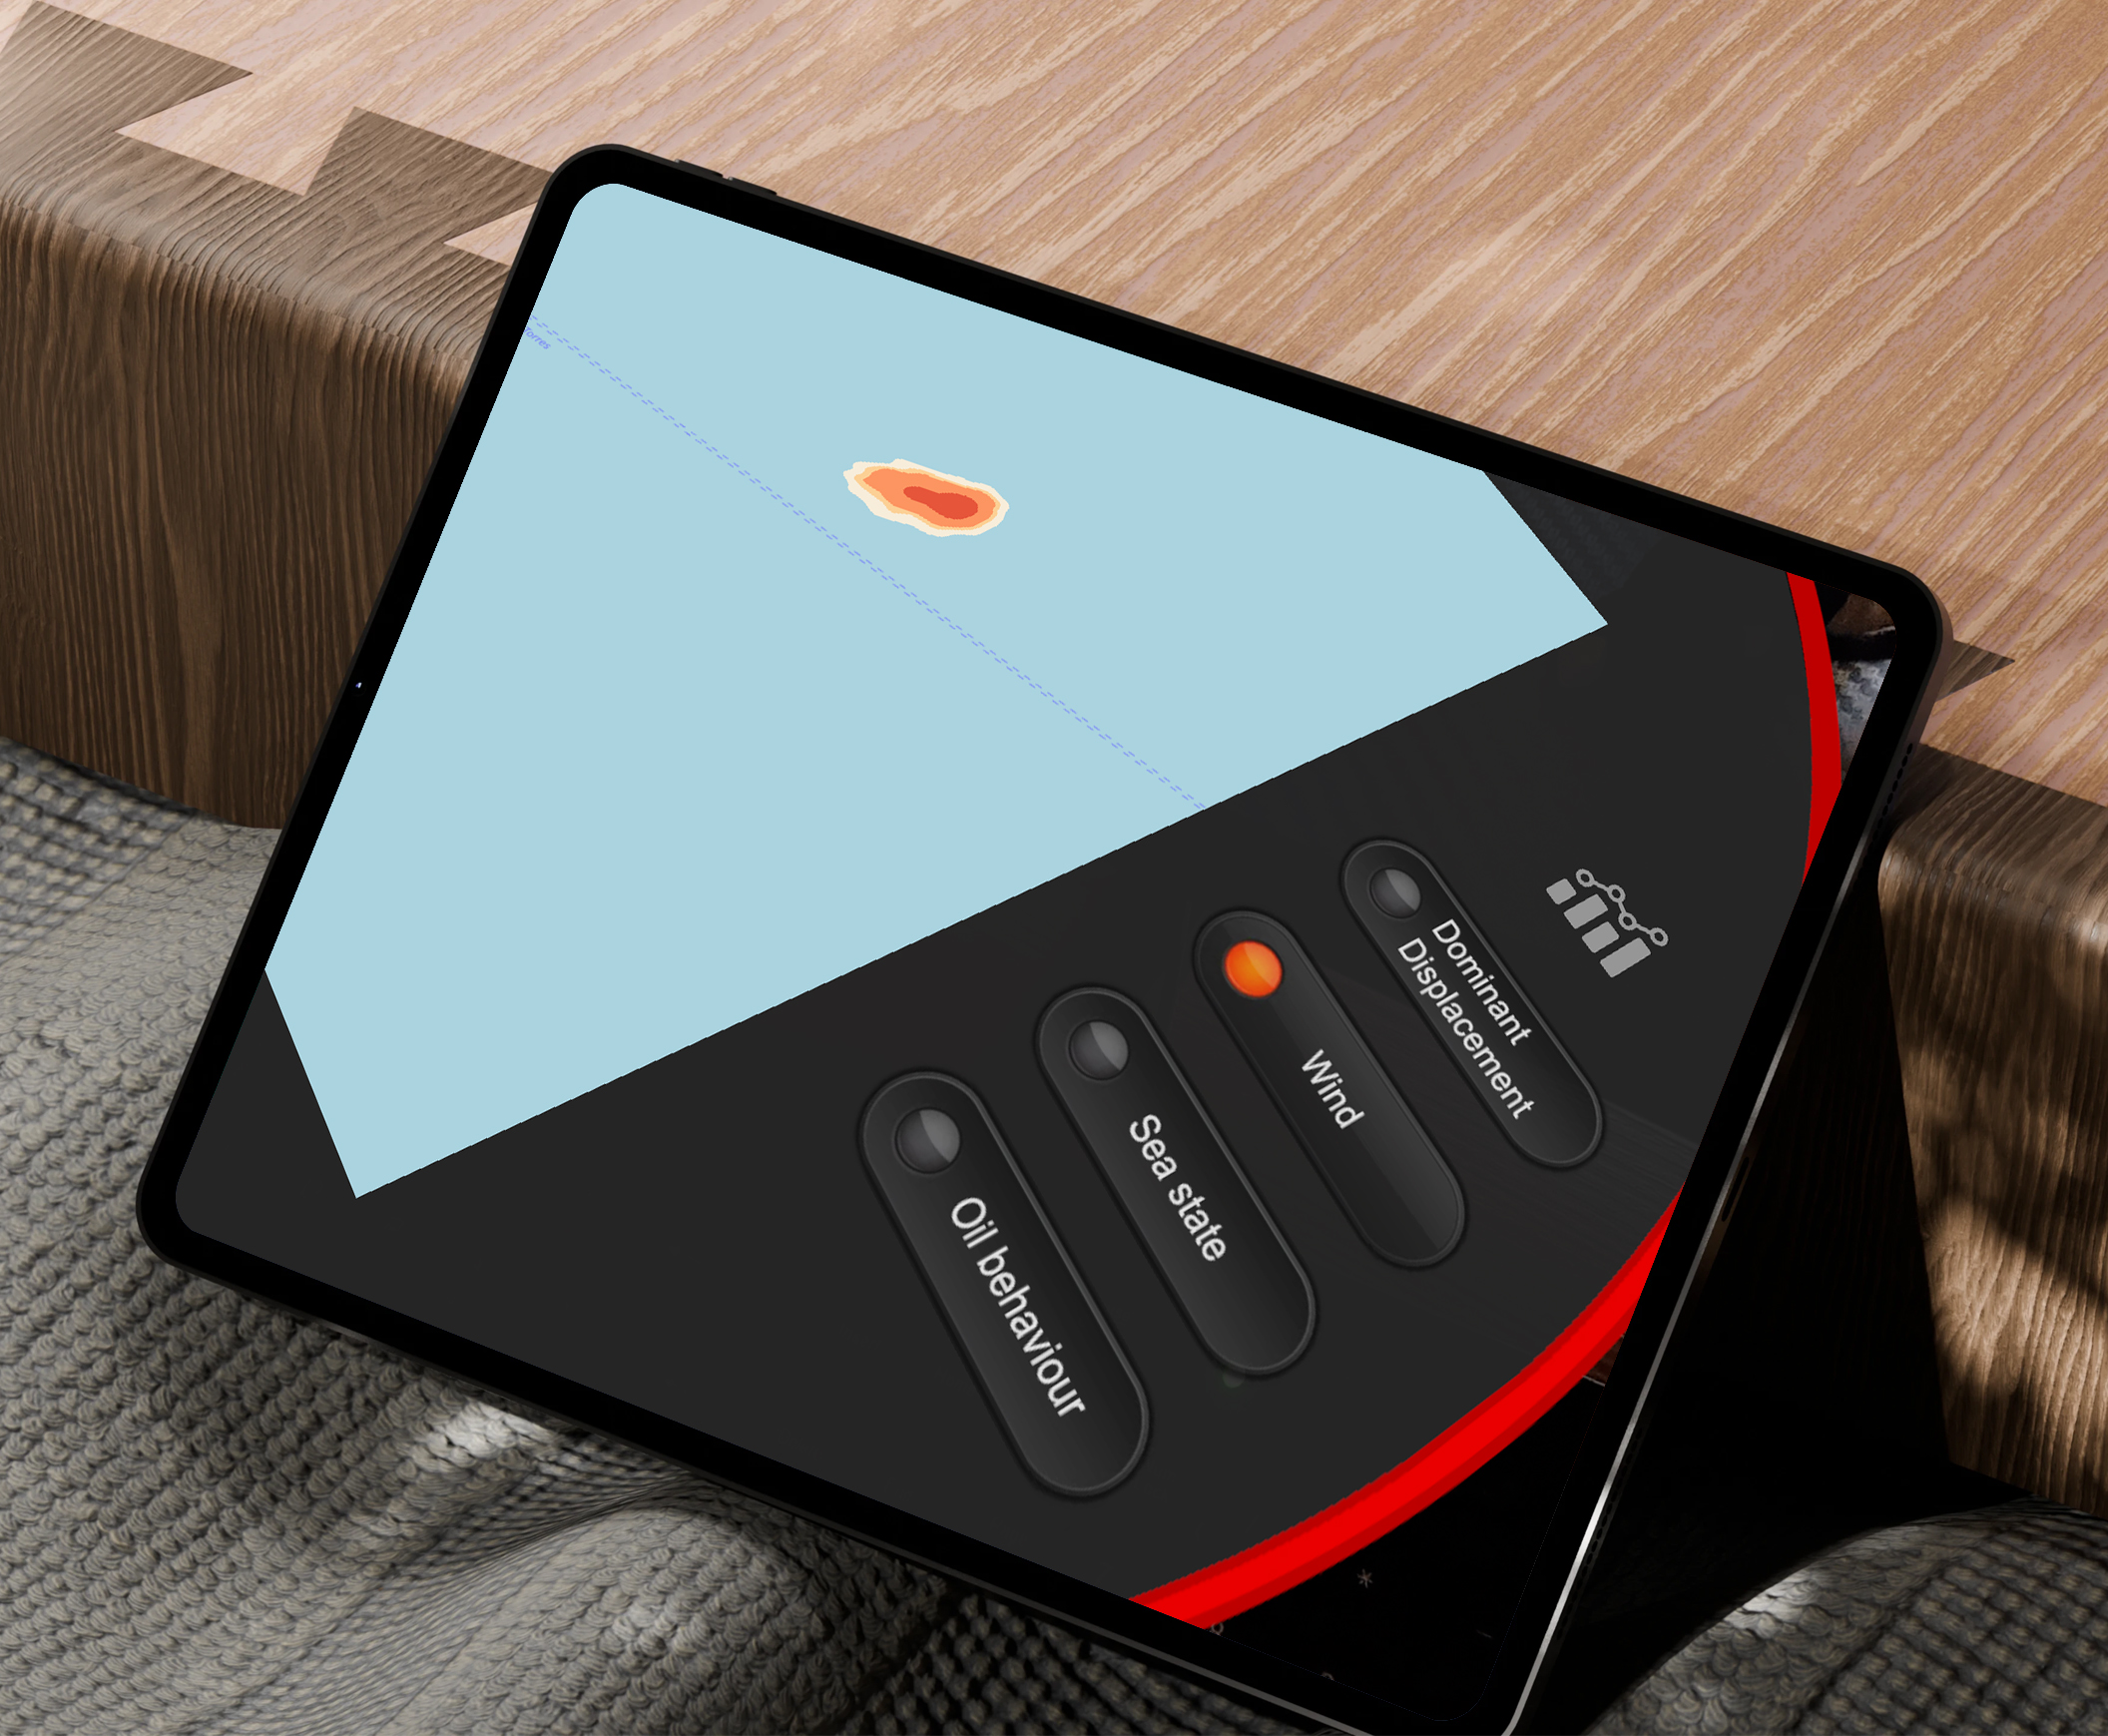
Floating indicators reveal wind, waves, displacement and oil behaviour.
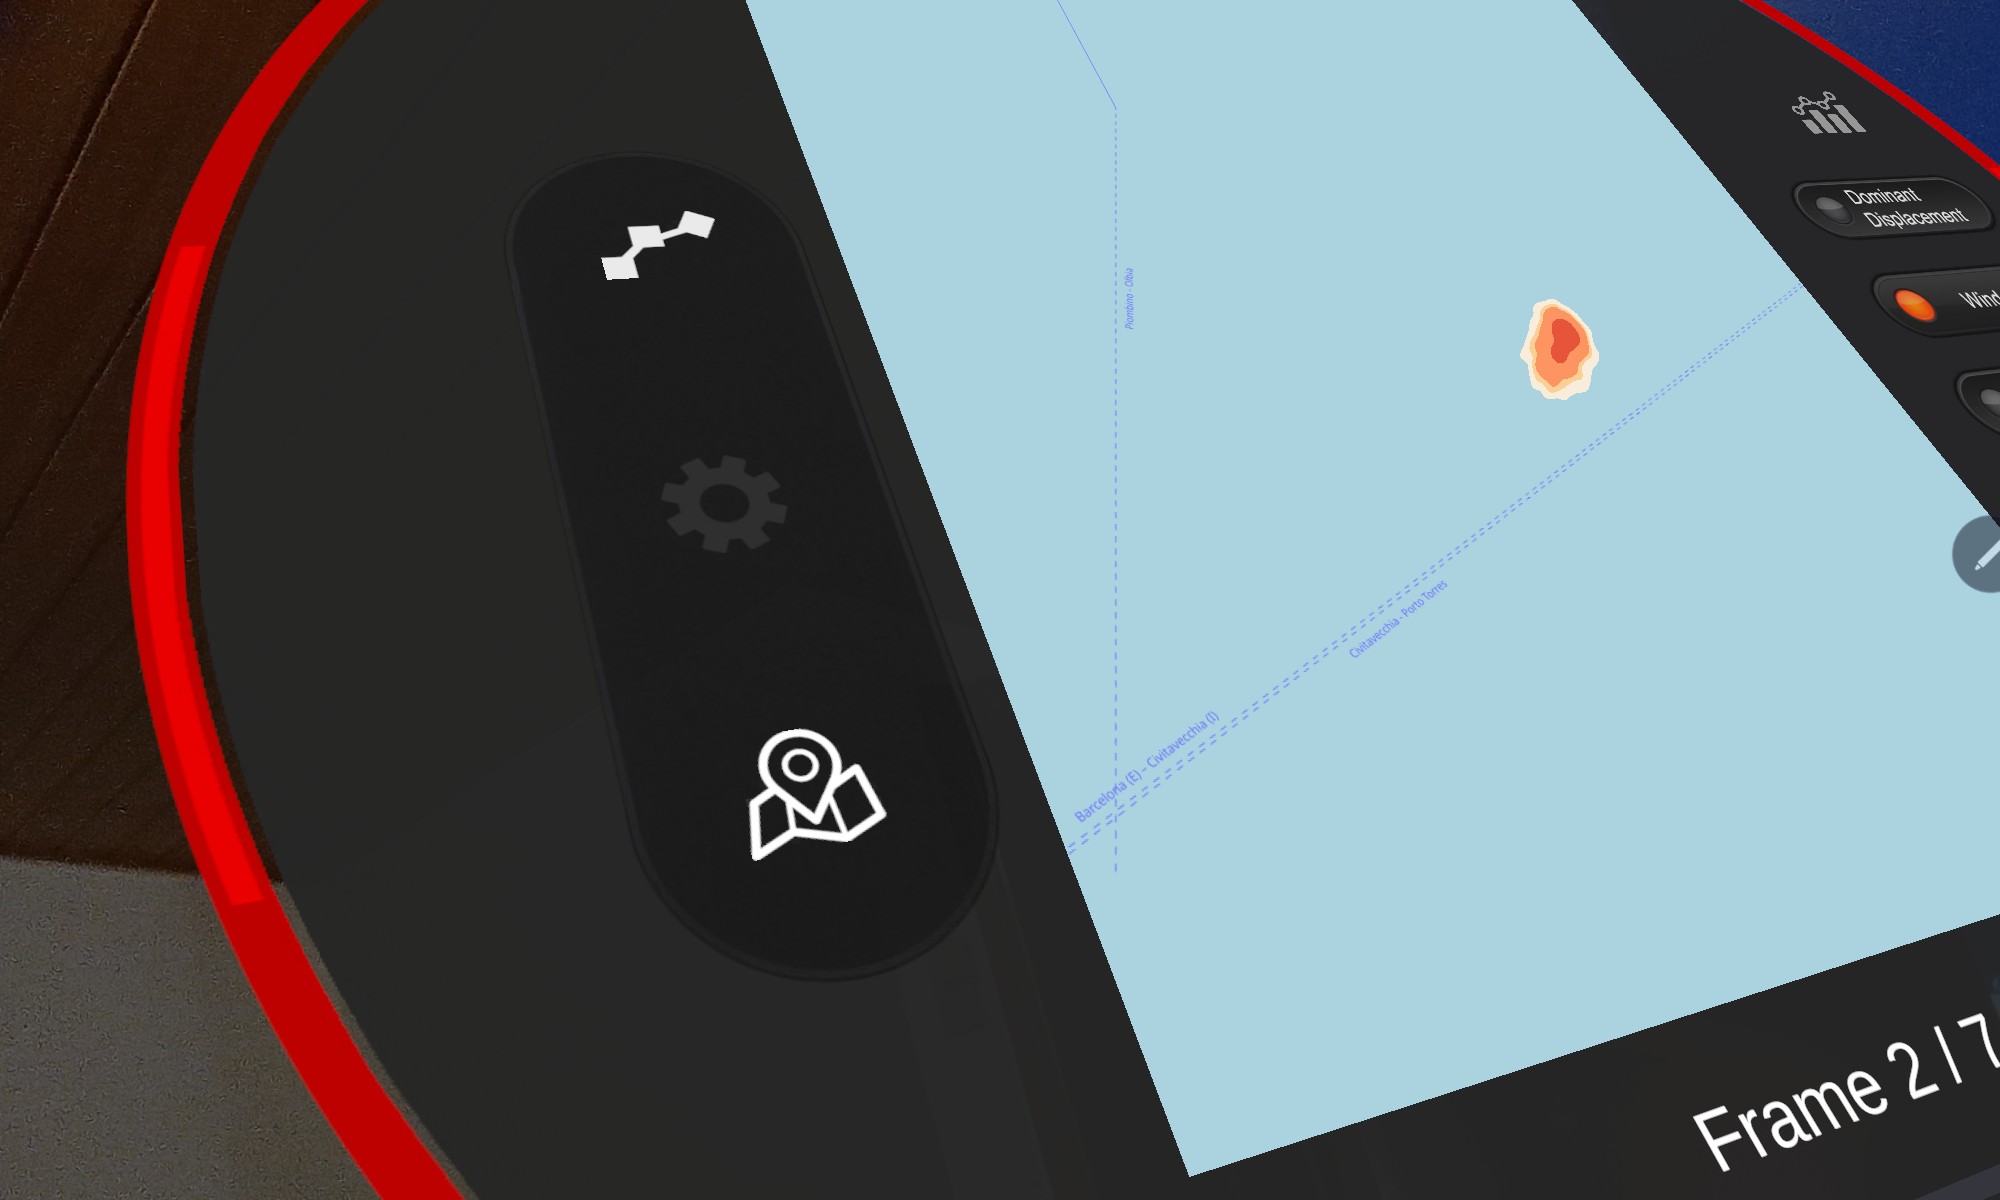
Playback controls reveal how concentration and shape evolve over time.
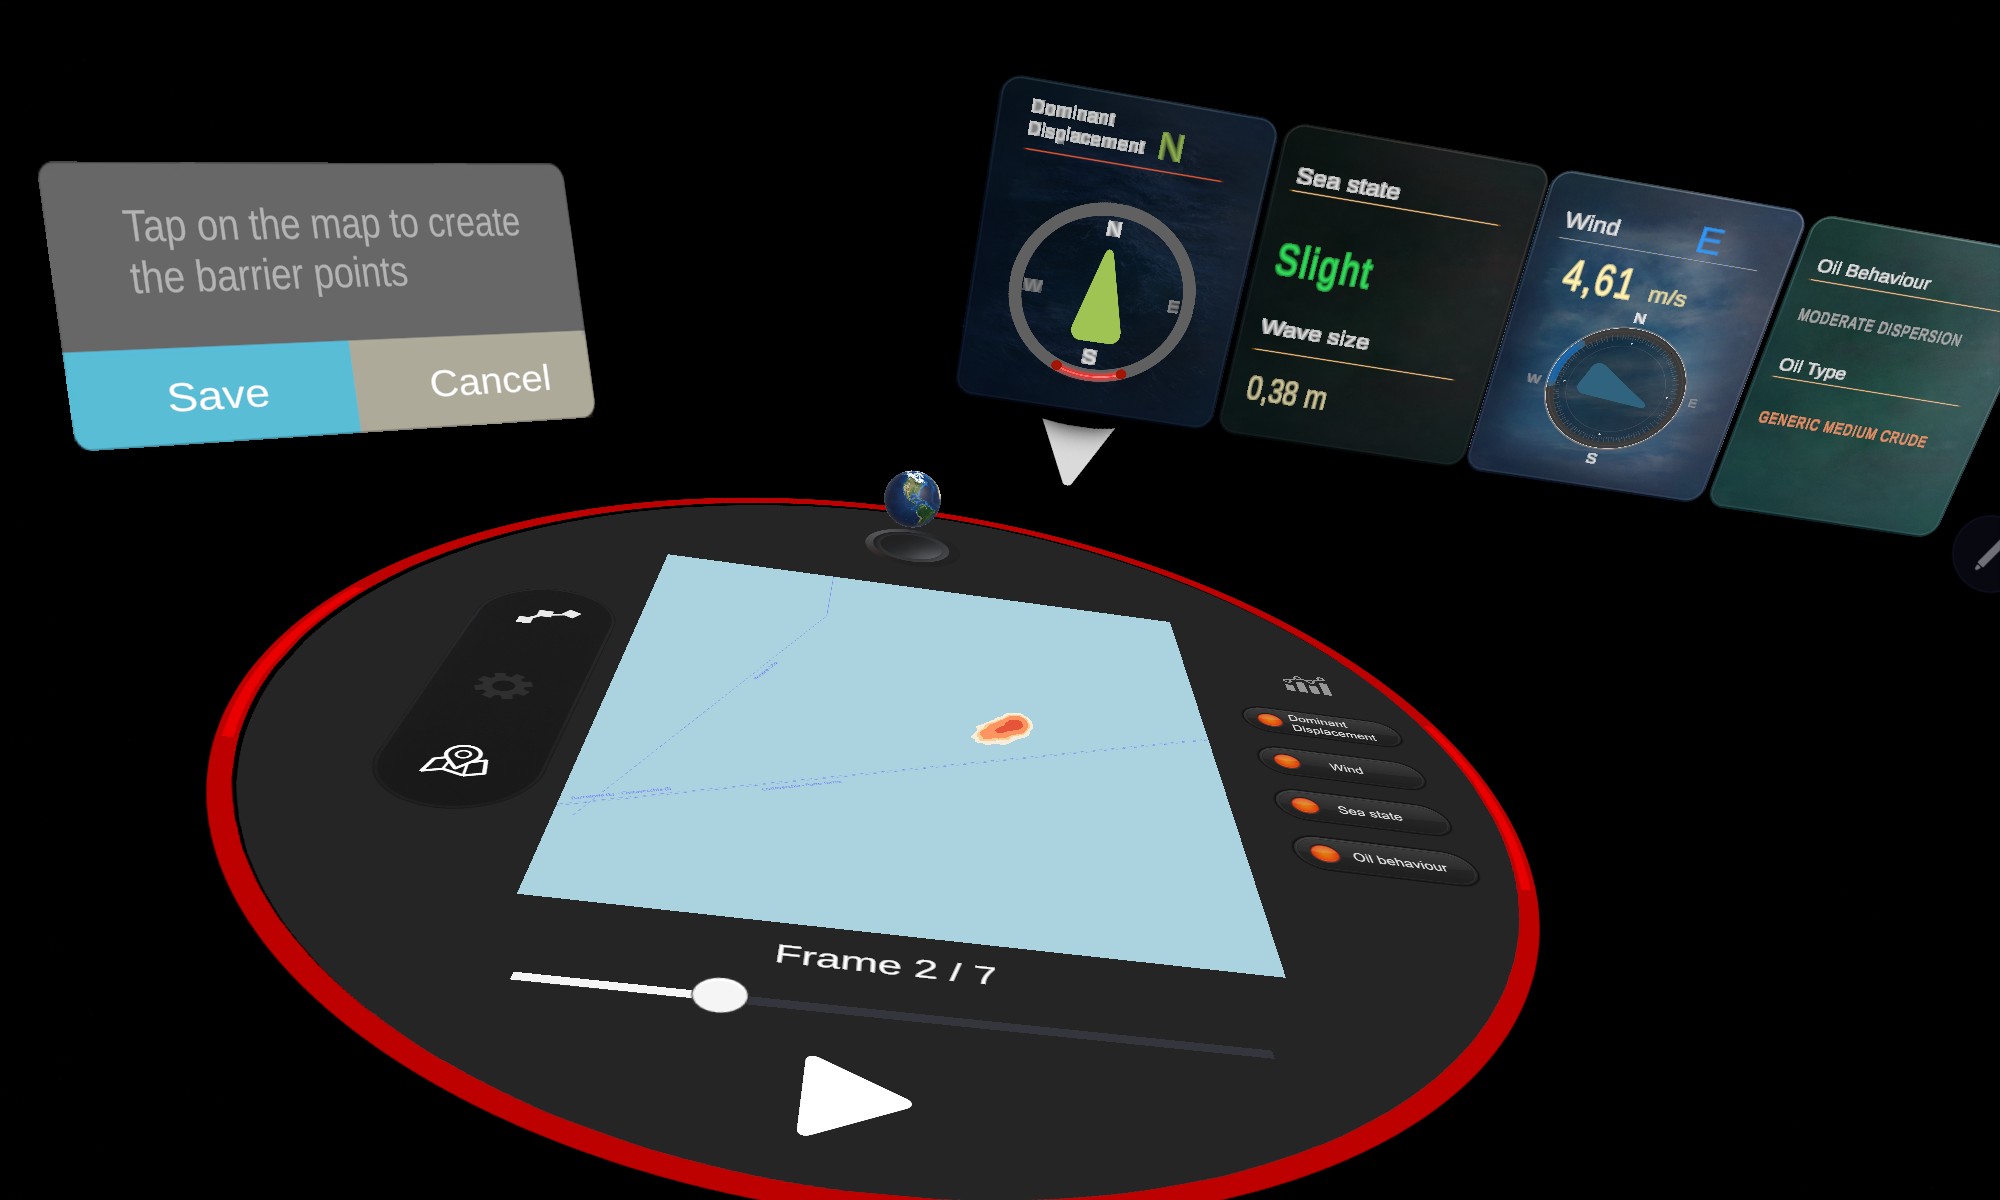
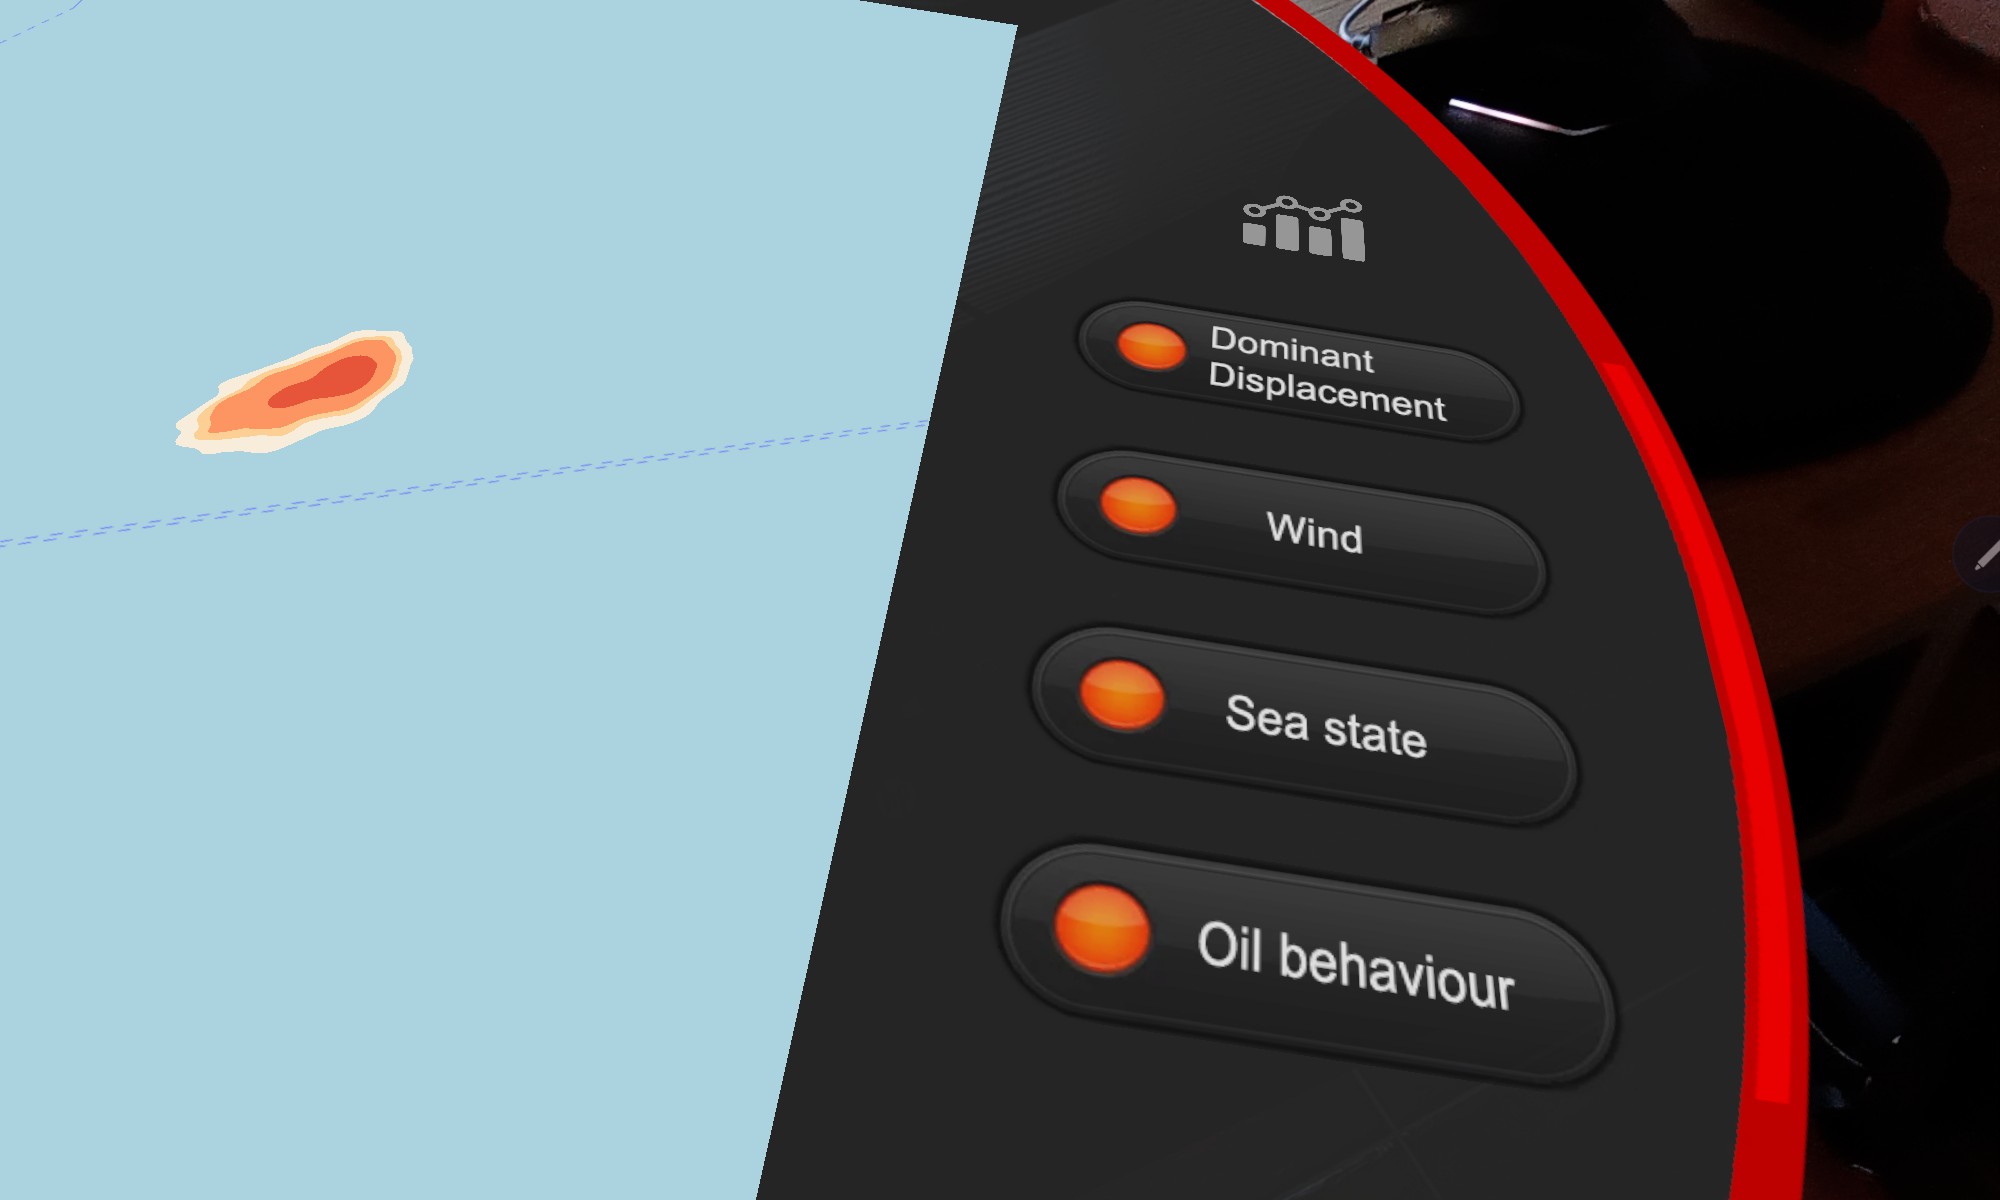
The georeferenced concentration field is shown directly over the coastal map.
Barrier points define the containment geometry used by the solver.
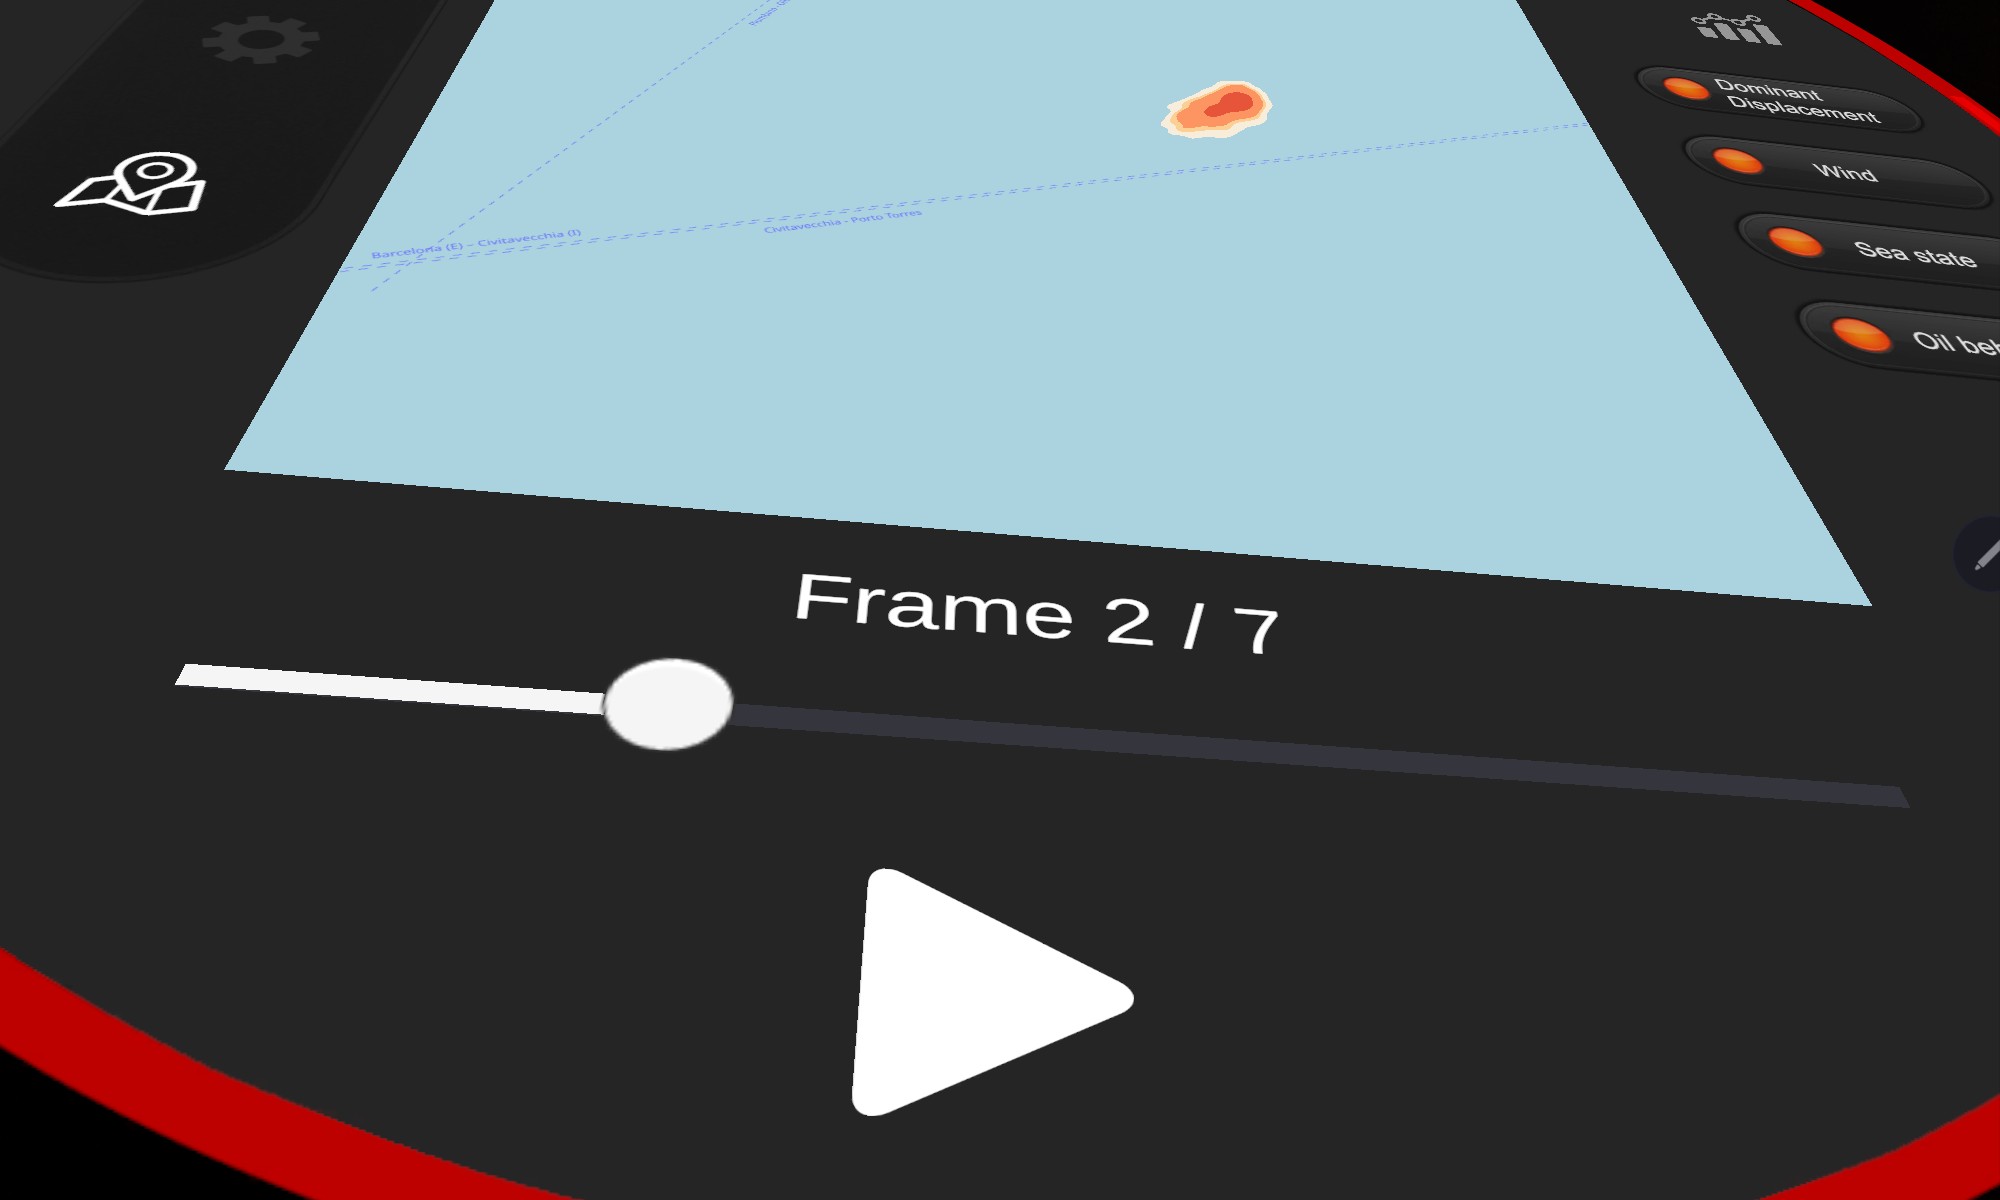
The simulation preserves the oil mass while adapting it to the new boundary.
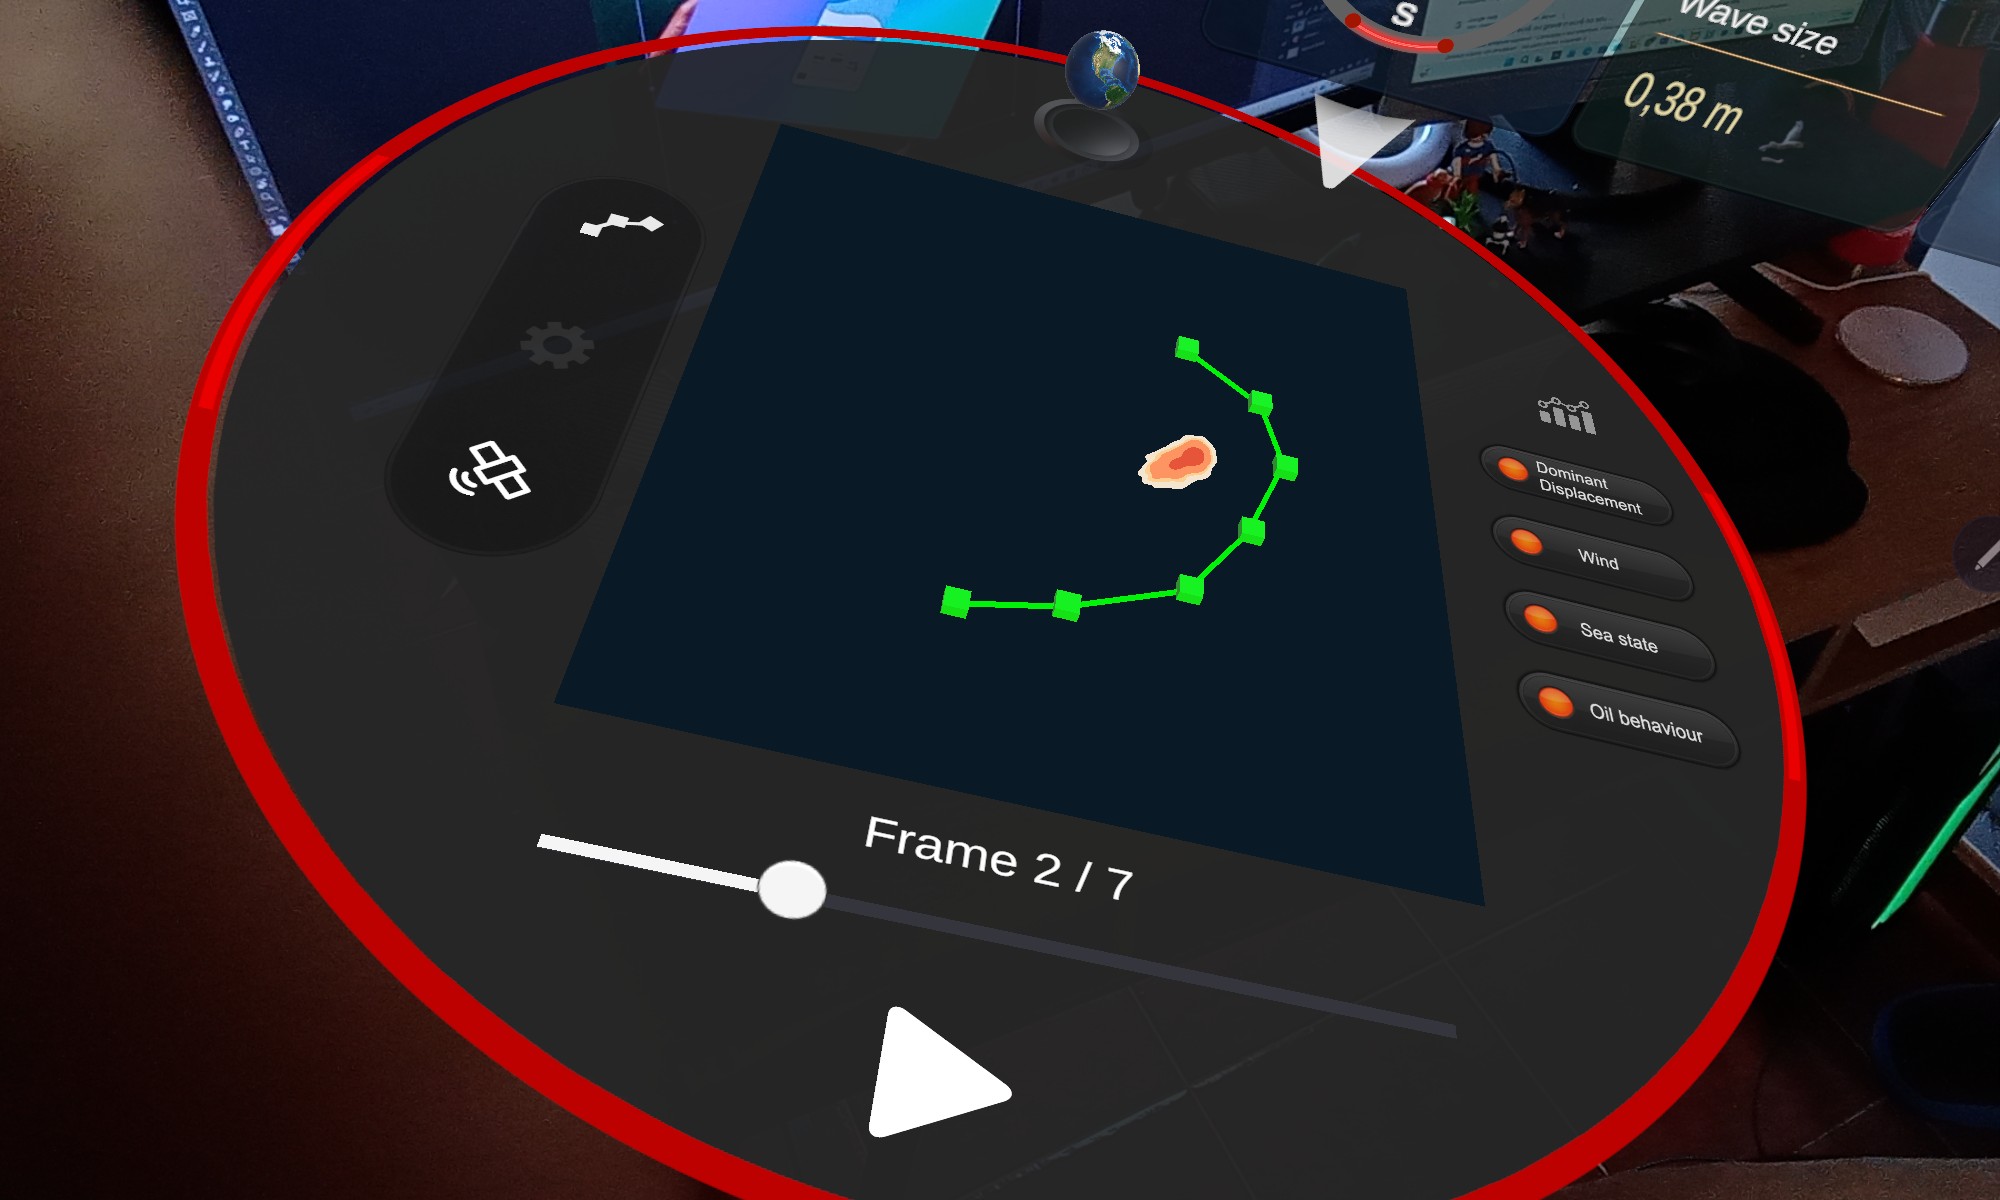
The final frames show accumulation and transport constrained by the barrier.
Supporting imagery documents the interactive scenario and its outcomes.
Tidal XR provides an immersive view of the HydroWing system, combining geolocated infrastructure with operational and environmental data. Teams can monitor conditions, identify anomalies, review recent activity and coordinate interventions within a shared spatial environment.
Follow a simulated descent, observe the operating turbines and trace an anomaly from the submerged component to a real-time mobile alert.
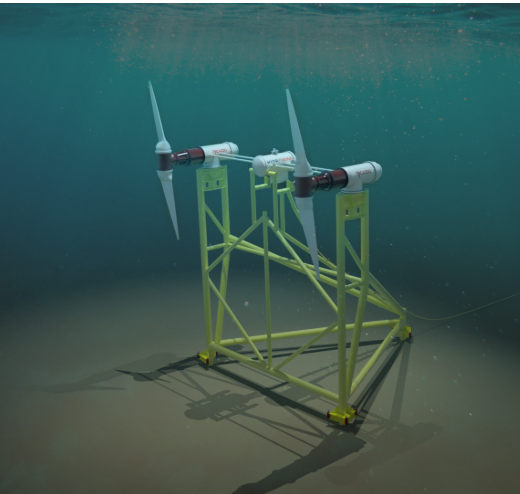
Scroll to descend through the water column. As direct visibility falls away, the asset is progressively revealed by a focused inspection light.
The seabed-mounted HydroWing is reconstructed as an inspectable three-dimensional asset. Both turbines operate while spatial and environmental context remains connected to the system.
Marine debris reaches Turbine 02. Its rotation falls below the expected threshold while the unaffected turbine continues to operate, allowing the anomaly to be isolated in the 3D asset.
The affected component is linked to a live mobile notification, providing location, severity and context for intervention and decision-making.
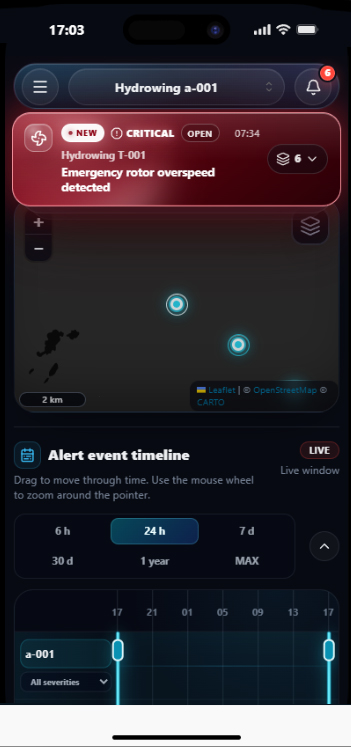
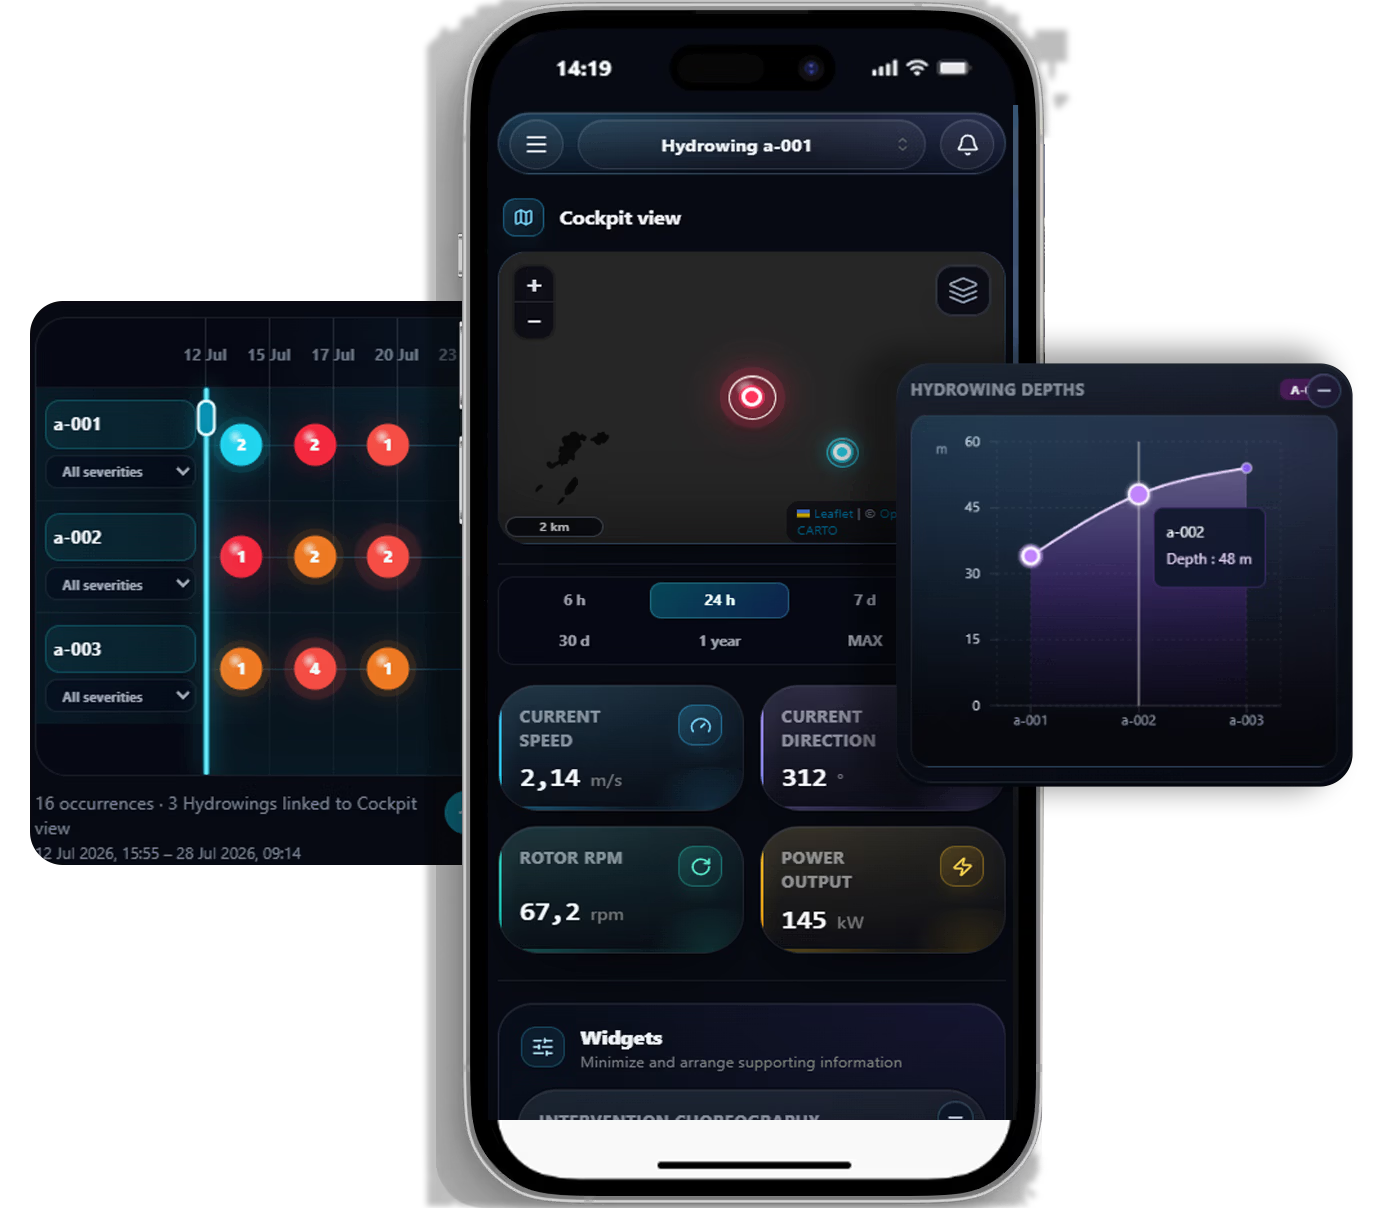
Satellite-derived data, geolocated HydroWing assets and operational events are brought together in one contextual interface. Interactive widgets reveal environmental conditions, asset locations and how incidents evolve across different time periods.
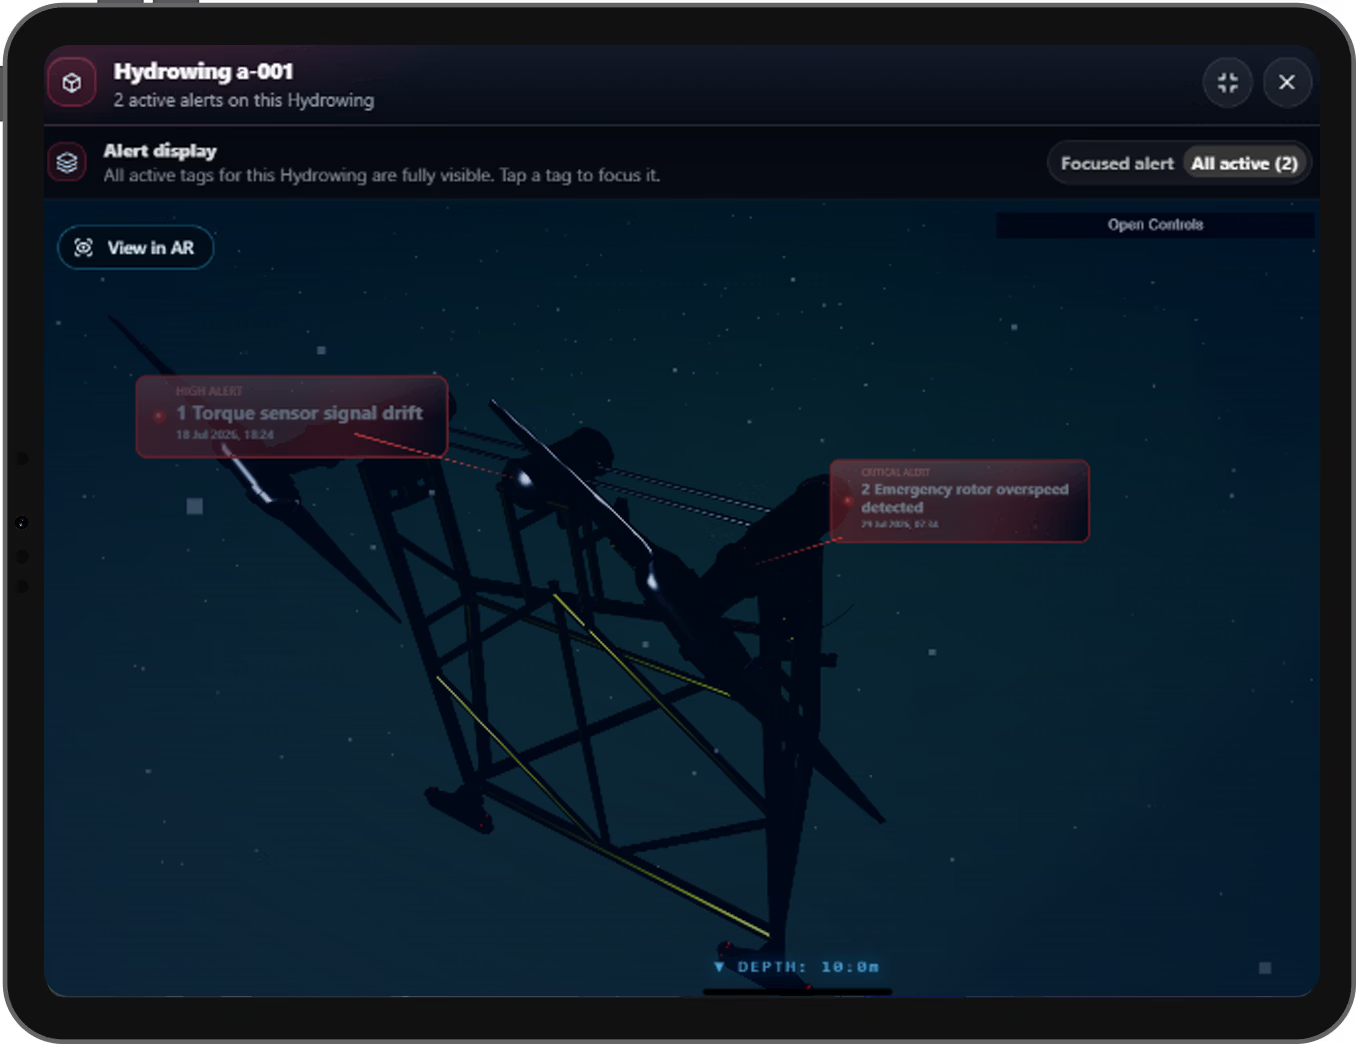
The interactive model identifies the exact component associated with each operational alert. Users can manipulate the HydroWing, inspect the affected area from different angles or place the asset in their physical environment through augmented reality. The view can isolate an event selected by date and time on the map or reveal every alert currently active across the system.
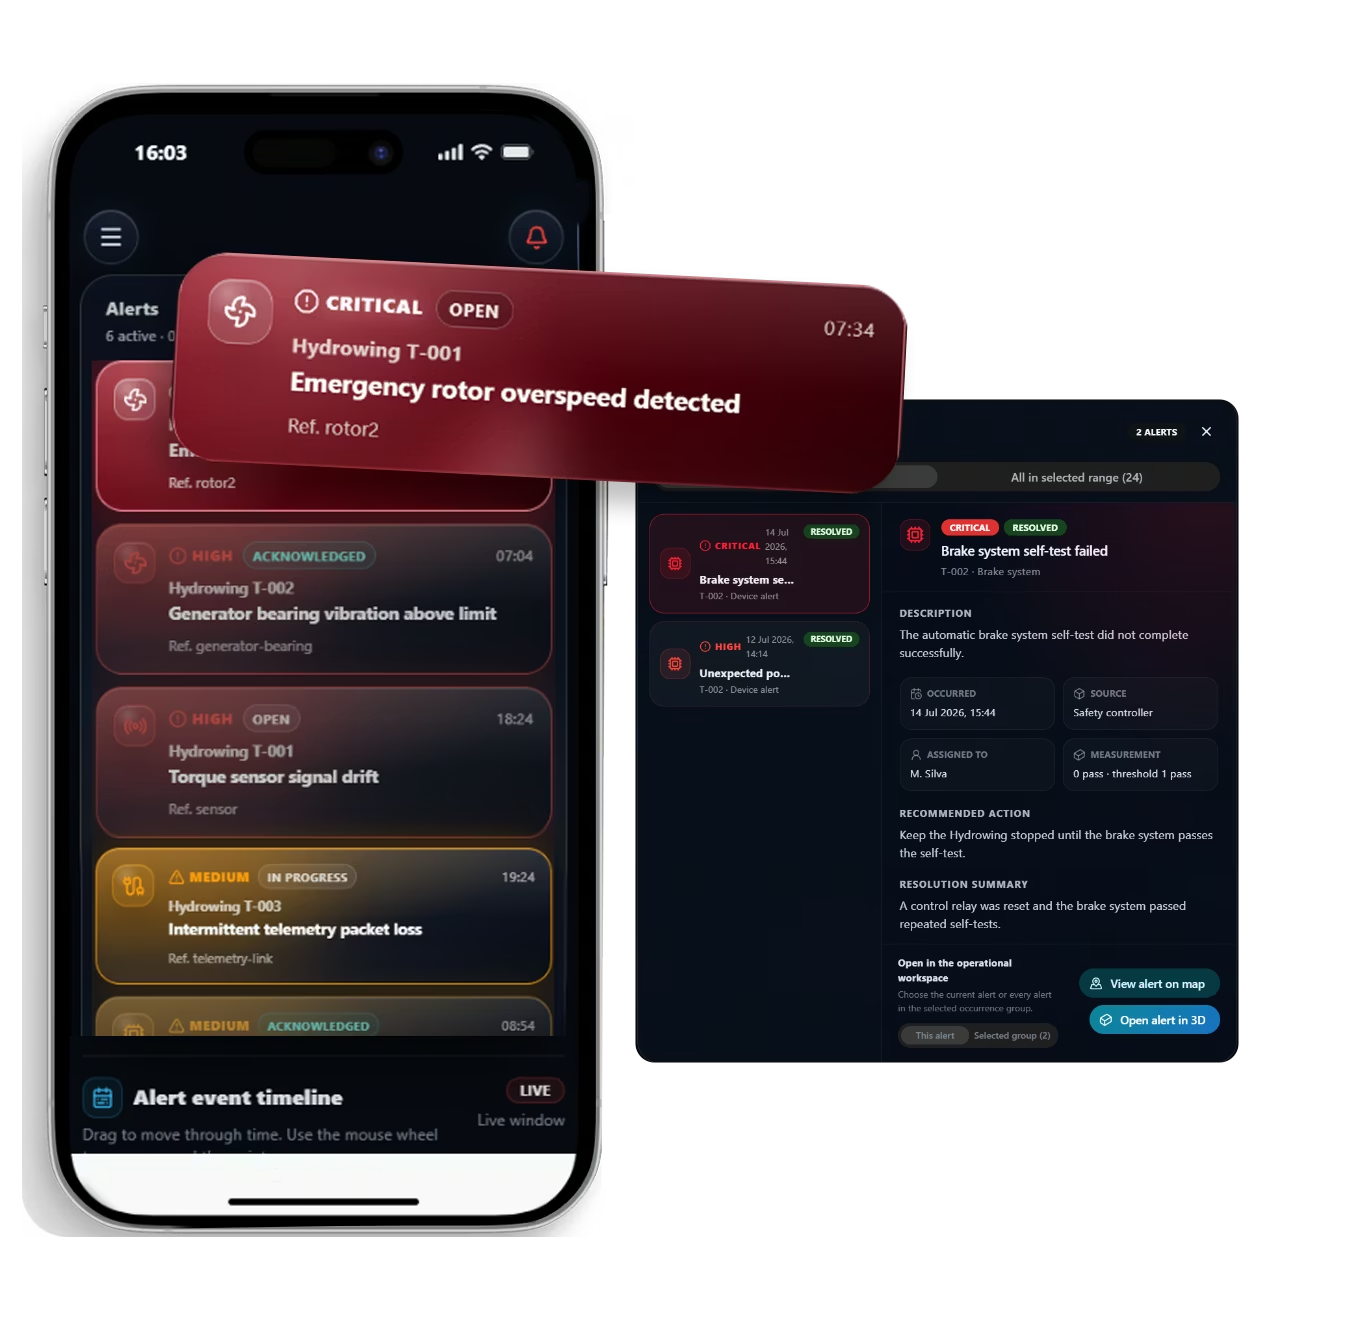
Operational alerts are displayed in real time and differentiated by type, severity and status. Each notification leads directly to the identified HydroWing and affected component, where occurrence details, source data, measurements, assigned responsibilities, recommended actions and resolution history support a traceable response from detection to closure.
Wind XR brings offshore wind infrastructure into a shared immersive environment, connecting asset visualisation with geospatial and operational information. It supports inspection, monitoring, collaborative planning and informed decision-making across the offshore energy lifecycle.
Deliverables, publications and APK packages presented as a clean, launch-ready archive.
BLUE-X brings together seven European partners to develop a satellite-based decision-support tool that accelerates offshore renewable energy deployment and unlocks the potential of offshore wind, solar, wave and tidal energy.
 EOMAP GMBH & CO. KG
Coordination
EOMAP GMBH & CO. KG
Coordination
 HORIZON-EUSPA-2022-SPACE
Project Call
HORIZON-EUSPA-2022-SPACE
Project Call
 INESC TEC
XR / T3.5 Lead
INESC TEC
XR / T3.5 Lead
 STICHTING DUTCH MARINE ENERGY CENTRE
 INYANGA TECH SAS
FÓRUM OCEANO — ASSOCIAÇÃO DA ECONOMIA DO MAR
INESC TEC — INSTITUTO DE ENGENHARIA DE
SISTEMAS E COMPUTADORES, TECNOLOGIA E CIÊNCIA
INYANGA TECH SAS
FÓRUM OCEANO — ASSOCIAÇÃO DA ECONOMIA DO MAR
INESC TEC — INSTITUTO DE ENGENHARIA DE
SISTEMAS E COMPUTADORES, TECNOLOGIA E CIÊNCIA
 WAVE FOR ENERGY SRL
POLITECNICO DI TORINO
Horizon Europe
Funding
WAVE FOR ENERGY SRL
POLITECNICO DI TORINO
Horizon Europe
Funding
Five team members are shown here. Hover each card for a lift, glow and line reveal effect.